📑 Table of Contents
- Mastering Core Web Vitals for Credit Union
- Why Core Web Vitals Matter for Credit Unions
- Largest Contentful Paint (LCP): Measuring and Optimizing
- Interaction to Next Paint (INP): Replacing First Input Delay (FID)
- Cumulative Layout Shift (CLS): Preventing Unexpected Shifts
- Tools for Measuring Core Web Vitals
- Advanced Optimization Strategies
- Case Studies: Credit Union Success Stories
- Intersecting Core Web Vitals with ADA Compliance
- Future of Core Web Vitals
- Conclusion
- References
- Related Posts
Table of Contents
Mastering Core Web Vitals for Credit Union
- Introduction to Core Web Vitals for Credit Union
- Why Core Web Vitals for Credit Union Matter
- Largest Contentful Paint (LCP): Measuring and Optimizing Core Web Vitals for Credit Union
In the competitive landscape of digital banking, credit union core web vitals are no longer optional—they’re essential for user satisfaction, SEO rankings, and conversion rates. Google’s Core Web Vitals provide a standardized way to measure real-world user experience on the web, focusing on loading performance, interactivity, and visual stability. For credit unions, where trust and speed are paramount, optimizing these metrics can mean the difference between a member completing a loan application or abandoning the site.
This comprehensive 3500+ word guide dives deep into Core Web Vitals—Largest Contentful Paint (LCP), Interaction to Next Paint (INP), and Cumulative Layout Shift (CLS)—tailored specifically for credit union websites. We’ll explore measurement, optimization techniques, case studies, and how these intersect with ADA compliance. By the end, you’ll have actionable strategies to boost your site’s performance and member engagement.
Why Core Web Vitals Matter for Credit Unions
Credit union websites handle sensitive financial transactions, member logins, loan calculators, and account dashboards. Slow or unstable pages lead to frustration, especially on mobile devices where 60% of banking traffic originates [1]. Google has integrated Core Web Vitals into page experience signals for ranking since 2021, impacting organic traffic for high-intent searches like “credit union near me” or “best CD rates.”
Statistics highlight the stakes:
- A 1-second delay in page load can reduce conversions by 7% [2].
- 53% of mobile users abandon sites that take over 3 seconds to load [3].
- Financial services sites with good Core Web Vitals see 24% higher conversion rates [4].
For credit unions competing with big banks and fintechs, superior credit union core web vitals build trust and loyalty. Optimized sites also improve accessibility, aligning with WCAG guidelines.
Largest Contentful Paint (LCP): Measuring and Optimizing
LCP measures the render time of the largest image or text block in the viewport, targeting under 2.5 seconds for good performance. On credit union homepages, this is often a hero banner with rates or a promotional slider.
Understanding LCP Metrics
LCP is calculated using field data from the Chrome User Experience Report (CrUX), representing real users. Thresholds:
- Good: ≤2.5s
- Needs Improvement: 2.5-4s
- Poor: >4s
Common LCP elements on CU sites: hero images, video backgrounds, large fonts in headlines.
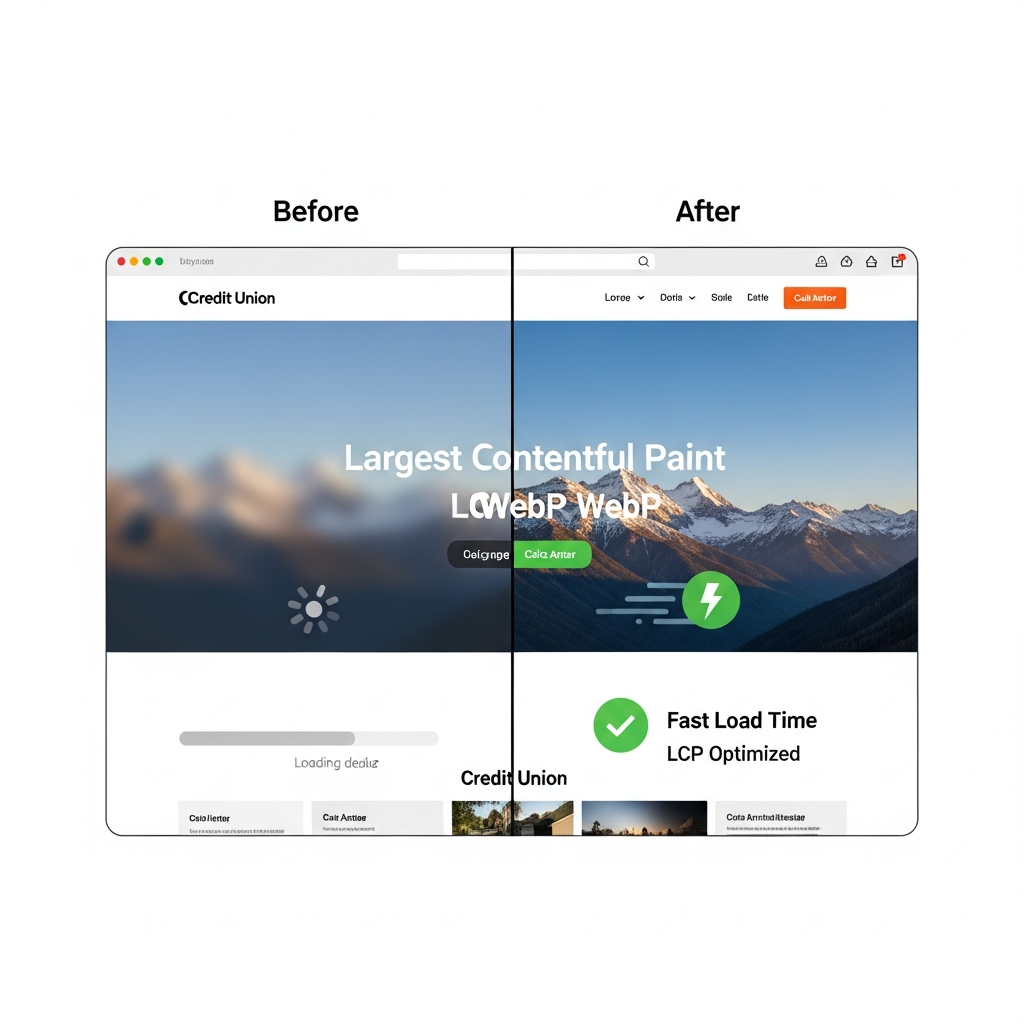
Figure 1: LCP optimization example—before (slow WebP load) vs. after (fast optimized image).
Credit Union-Specific LCP Strategies
1. Image Optimization: Use modern formats like WebP or AVIF. Compress hero images to <100KB without quality loss. Implement lazy loading for below-fold images.
Code example:

2. Critical Rendering Path: Inline critical CSS/JS. Preload key resources: .
3. Server-Side Rendering (SSR): For React/Vue sites, SSR reduces LCP by 30-50% [5].
4. CDN Usage: Edge caching via Cloudflare or AWS CloudFront cuts TTFB.
Case: A mid-sized CU reduced LCP from 4.2s to 1.8s by optimizing images and enabling compression, boosting applications by 18%.
Interaction to Next Paint (INP): Replacing First Input Delay (FID)
INP, rolling out in 2024, measures responsiveness from click to visual feedback, targeting <200ms. Critical for CU sites with forms, buttons for "Apply Now" or "Transfer Funds."
Causes of poor INP: Long main-thread tasks from unoptimized JS libraries, third-party scripts (analytics, chatbots).
Optimization:
- Break up long tasks with Web Workers.
- Optimize input handlers: Use passive listeners for scroll/touch.
- Defer non-critical JS: